Requirements
- Roof Quote PRO™ active subscription
- Admin or Manager access
Overview
The Analytics Dashboard gives you a centralized view of how your instant quote tools are performing. Track lead volume, page conversions, project details, top products, tool interactions, and financing activity — all in one place. Use filters to drill down by market, lead status, or date range. The analytics dashboard is broken down into 4 main categories:
Getting Started
- Log in to your PRO portal.
- Click on Analytics.
- Filter the page (if needed) by clicking the filter button in the top right corner. Analytics can be filtered by Market, Lead Status, and Date. If any filters are selected, all values on the page will update to reflect those settings.
Lead Conversions
This section displays your Grand Total of Leads, broken down into three categories:
- Total Web Leads — leads generated through your instant quote tool
- Total Other Contacts — not market specific
- Total Address Only Leads — not market specific
Page Conversion
The Page Conversion table tracks every page where your instant quote tool is installed. For each page, you'll see Pageviews, Leads, and a Conversion %.
PRO TIP: By default, the Page Conversion section combines metrics for identical URLs with different parameters.
However, if you have a single landing page with UTM parameters to track different sources (Google, yard sign, truck wrap, etc.), you can view the conversion for each source individually. Look for the Group URLs toggle and turn it off. This will separate all identical URLs by their parameters so you can examine each one accordingly.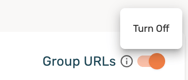
Total RoofQuote PRO® Views
This section shows your total tool views, broken down into key funnel stages:
- Address Loaded — unique addresses entered (not market specific)
- Contact Form Displayed — number of times the "Almost Done" form was shown
- Contact Form Submitted — number of times the contact form was completed
- Product Requested CTA — number of times details were sent to users
Each metric includes a count and a percentage of total views.
Project Details
This section provides insight into your quoting activity:
- Average Quote — the average quote value across your leads. Use the dropdown to filter by a specific product and market. Also displays the highest and lowest quote prices.
- Average Project Size — the average total square footage of roof for all structures. Toggle Show in SQ to switch between square feet and roofing squares.
- Top Products — a ranked table of your most popular products by number of details sent, showing the product name, price, and market.
Other Information
This section tracks Total Tool Interactions and breaks them into two categories:
Map Interactions
- Edit Roofs Clicked — number of times users edited roof structures
- Slope Changed — number of times users changed the slope
- Roof Renamed — number of times users renamed roof structure(s)
- Roof Inclusion Toggled — number of times users included or removed a structure from a quote
Forms Interactions
- Help Form Displayed — number of times the "Get Help" form was shown (not market specific)
- Help Form Submitted — number of times the "Get Help" form was submitted (not market specific)
- Outside Service Area — number of addresses that were outside of your service area (not market specific)
- Data Unavailable — number of addresses searched where data wasn't available (not market specific)
Finance Analytics
If you have ContractorLoan PRO™ enabled, this section tracks your financing activity:
- Total Finalized Loan — loans that were successfully finalized
- Total Canceled Loan — loans that were canceled
- Average Approved Loan Amount — the average amount of approved and accepted loans